AI Analytics for the physical world.
Go beyond counting. Understand how people move, gather, and spend time in your spaces, using your existing cameras and infrastructure.

Concourse · todayvs last week
Trusted by global operators across industries



Know your traffic, hour by hour.
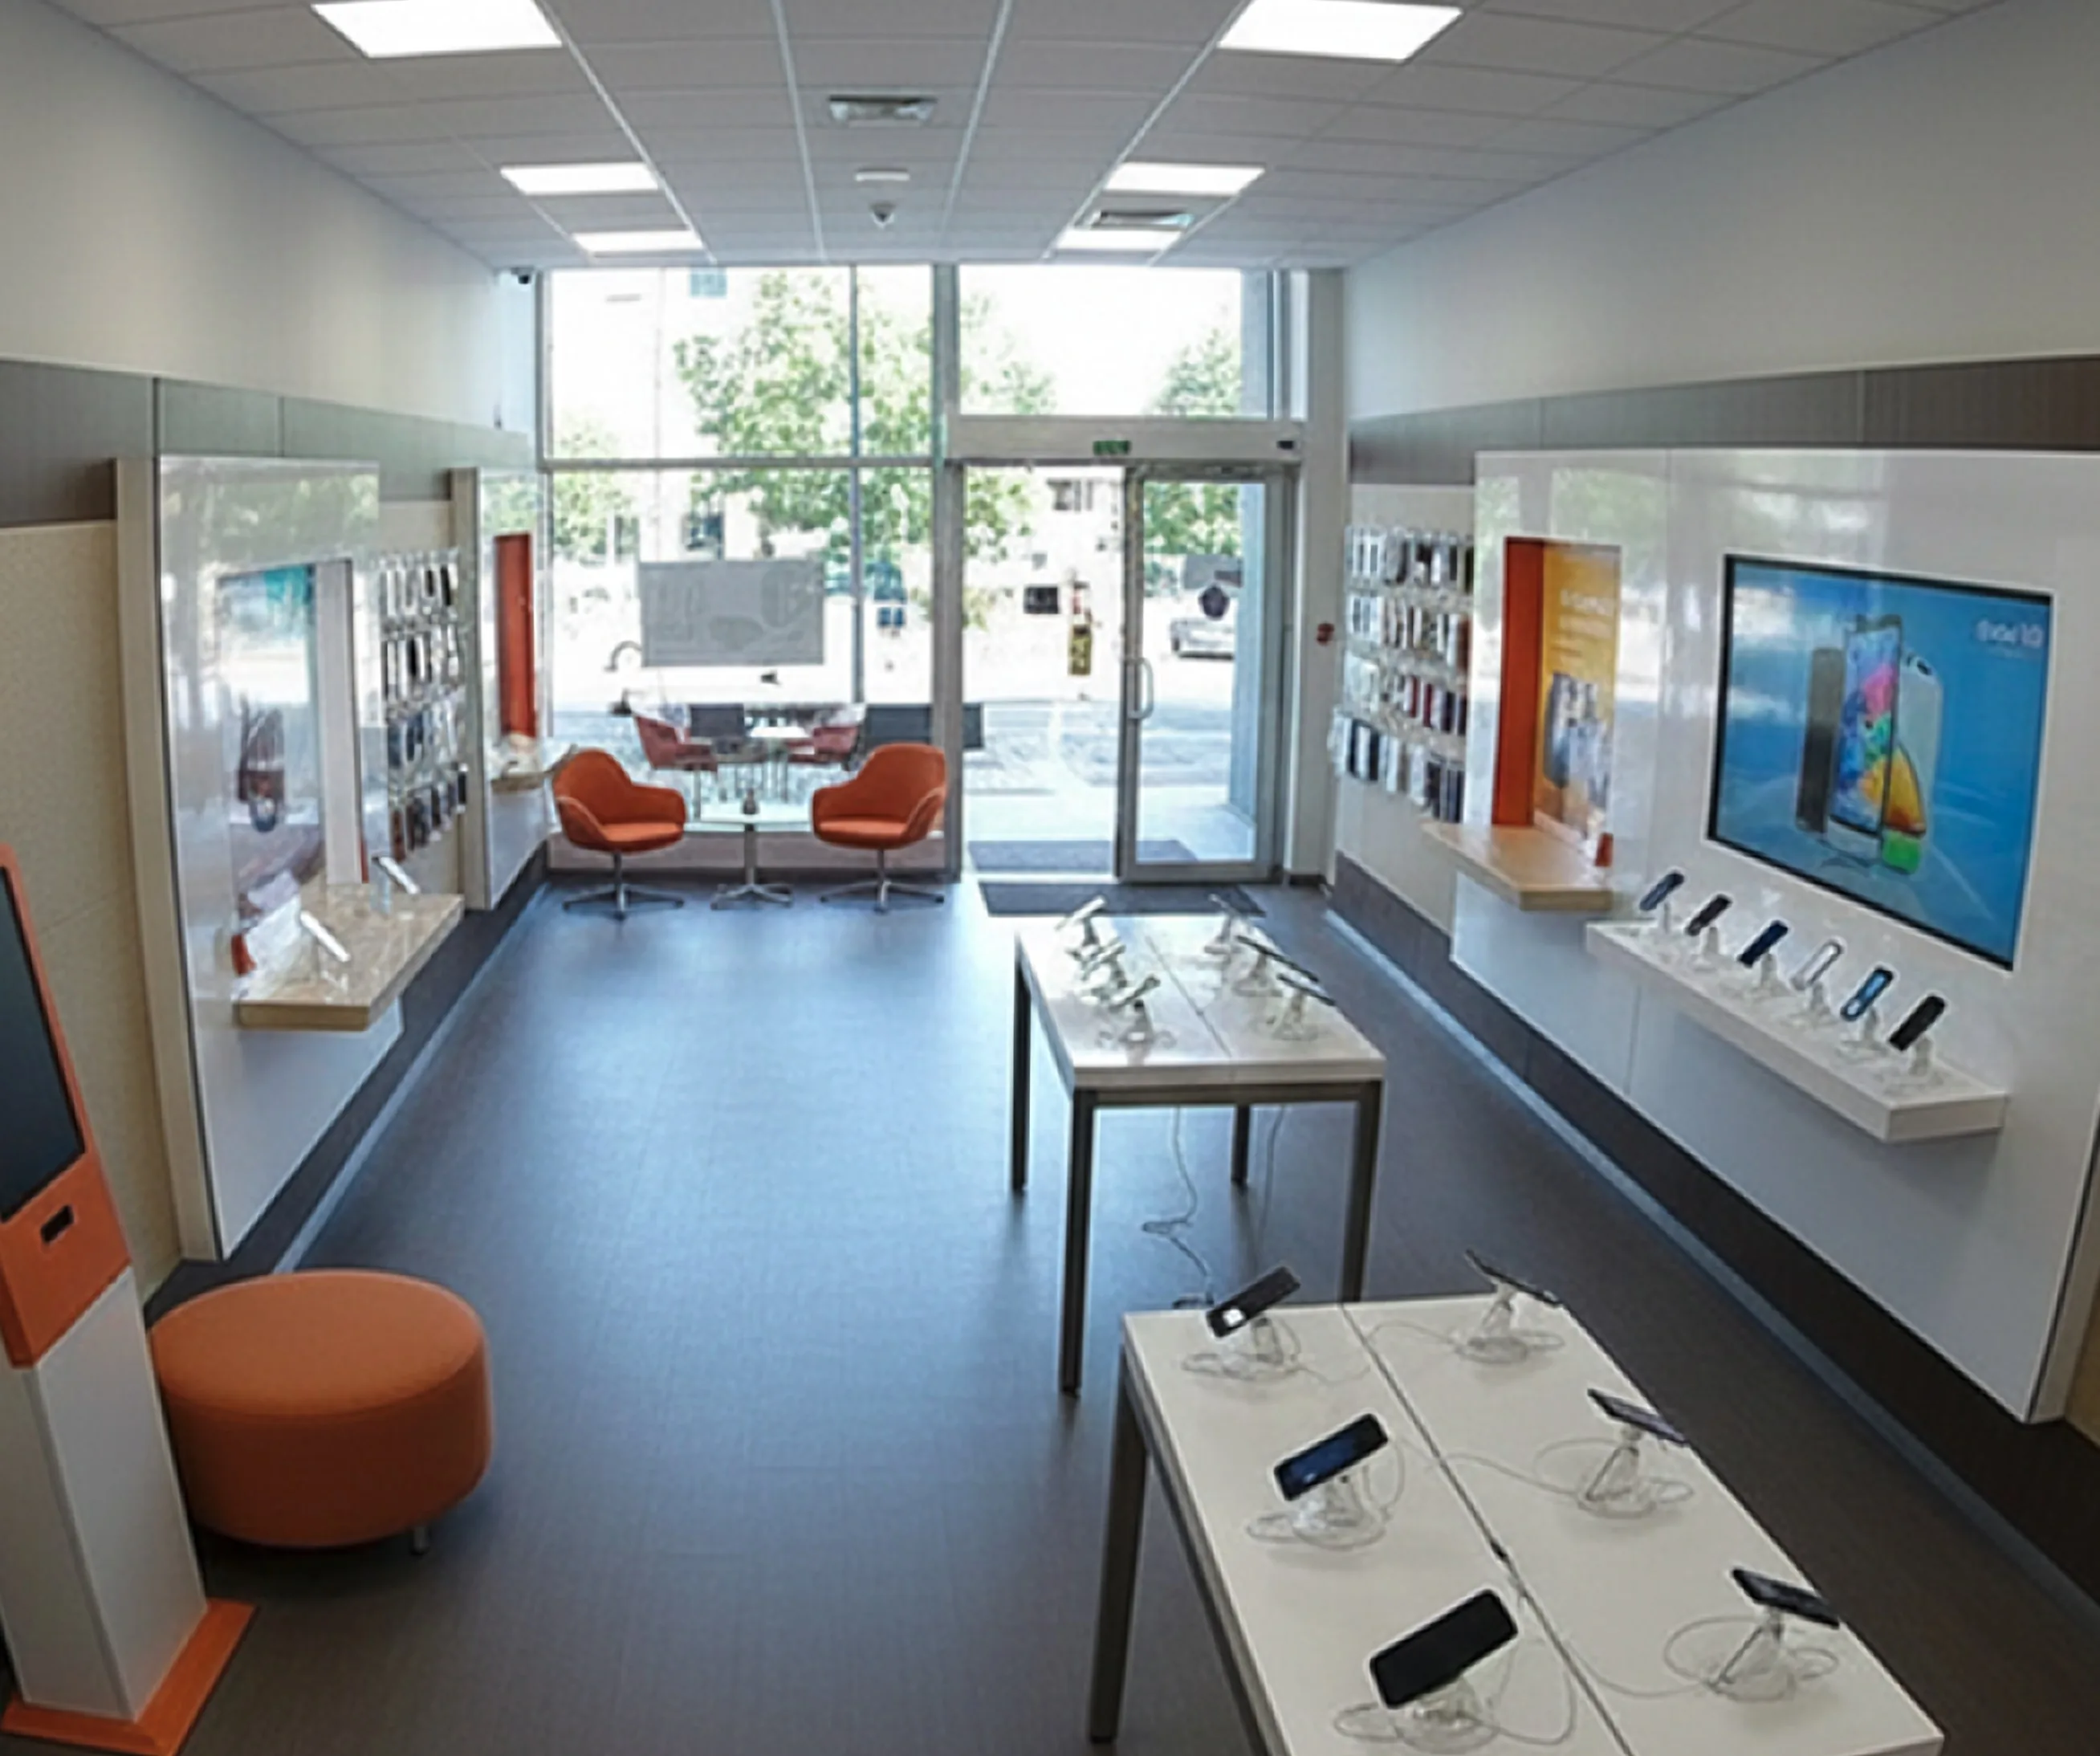
Understand visitor volumes, group sizes, and peak hours throughout the day and across your locations.
Today's Metricsvs last week
People Counting
Visitor Trend
Spot the trends walking through your door.
Get to know your visitors like never before. Discover emerging trends with a new level of detail.
Advanced Observed Attributes

White sneakers
Denim jacketsDiscover detailed visitor attributes, uncover emerging trends, and understand how your audience evolves over time.
KnitwearCustomer Persona
| Gender × age range | 0–12 | 13–17 | 18–24 | 25–34 | 35–44 | 45–54 | 55–64 | Total |
|---|---|---|---|---|---|---|---|---|
| Women | 1 | 1 | 22 | 59 | 22 | 14 | 8 | 127 |
| Men | 0 | 0 | 32 | 33 | 3 | 11 | 0 | 79 |
| Total | 1 | 1 | 54 | 92 | 25 | 25 | 8 | 206 |
- Women · 25–345929%
- Men · 25–343316%
- Men · 18–243216%
- Women · 18–242211%
- Women · 35–442211%
- 6 smaller segments3818%
Go beyond basic demographics. Explore detailed visitor segments, uncover relationships between attributes, and build a deeper understanding of your audience.
Discover what captures attention.
Reveal where people spend time, what draws them in, and which areas go overlooked.
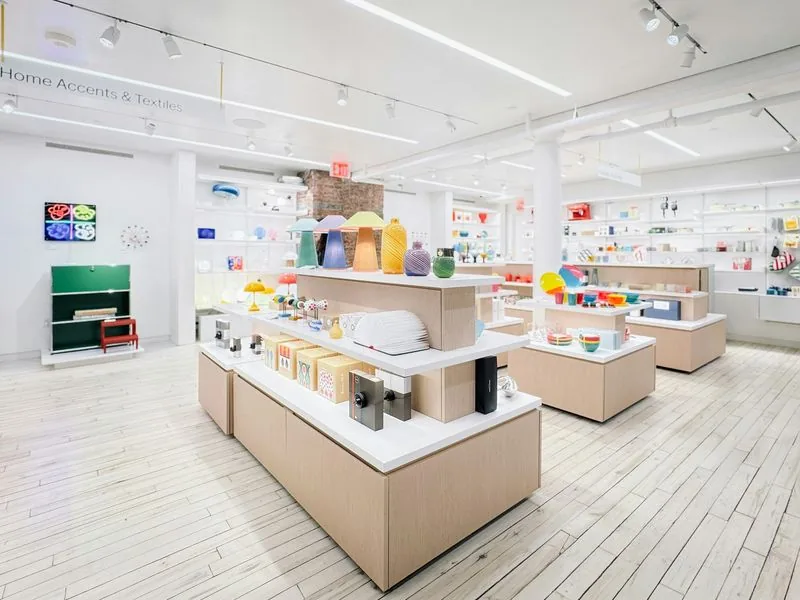
Dwell Time & Heatmaps

Most handled demo devices · today
- 1Flagship phone
42 - 2Foldable phone
29 - 3Tablet
18
Keep every line moving.
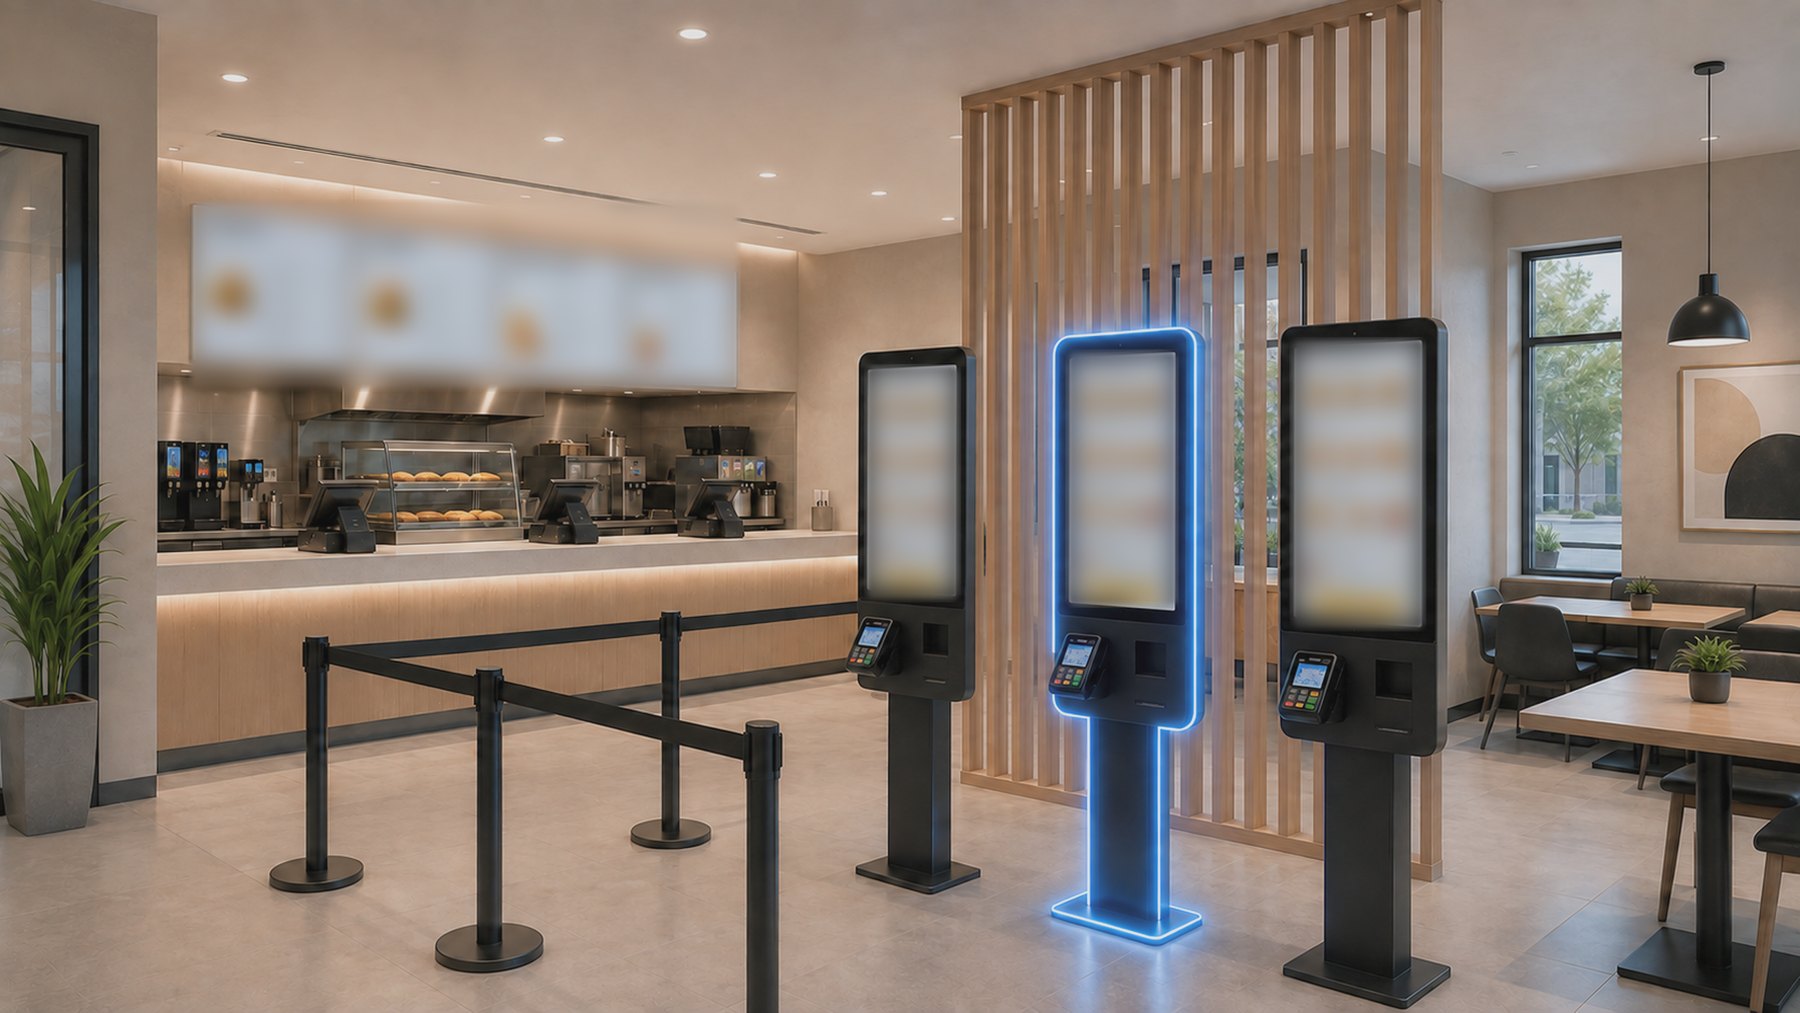
Track wait times, identify bottlenecks, and improve the flow of people across your locations.
Today's Metricsvs last week
Queue Times

Open a third till from 11:00 to 13:00. That is when waits ran over the 3‑minute target today, peaking at 4m 20s at 12:00. Waits come close to target again around 18:00, so keep a till on standby then.
Service Utilization
Staff present 75% of the day, actively serving for 67% of that time.
Ask about your data.
Ask in plain language. Edgar explains your data and reveals opportunities to improve.
Analysis with Edgar
Why did conversion drop at Eastgate last week, and what should we change?
Conversion fell from 24% to 19%, despite an 8% increase in visitors. Longer evening queues appear to be a key factor. Wait times doubled after 17:00, and 1 in 5 customers left the queue before being served.
Recommended Action: Consider opening a third till from 17:00 to 19:00. Queen Street uses additional coverage during similar evening traffic and achieves 25% conversion.
Designed with security and privacy you can trust.
Edge Signal combines reliability, control, and protection to help businesses deploy and scale Physical AI with confidence.
Enterprise & Security

SOC 2
Independent assessment of security controls against the AICPA Trust Services Criteria.

GDPR Compliant
Data processing practices and privacy controls designed to support GDPR requirements.
Get started
Explore the rest of Edge Signal, or bring us a question of your own.
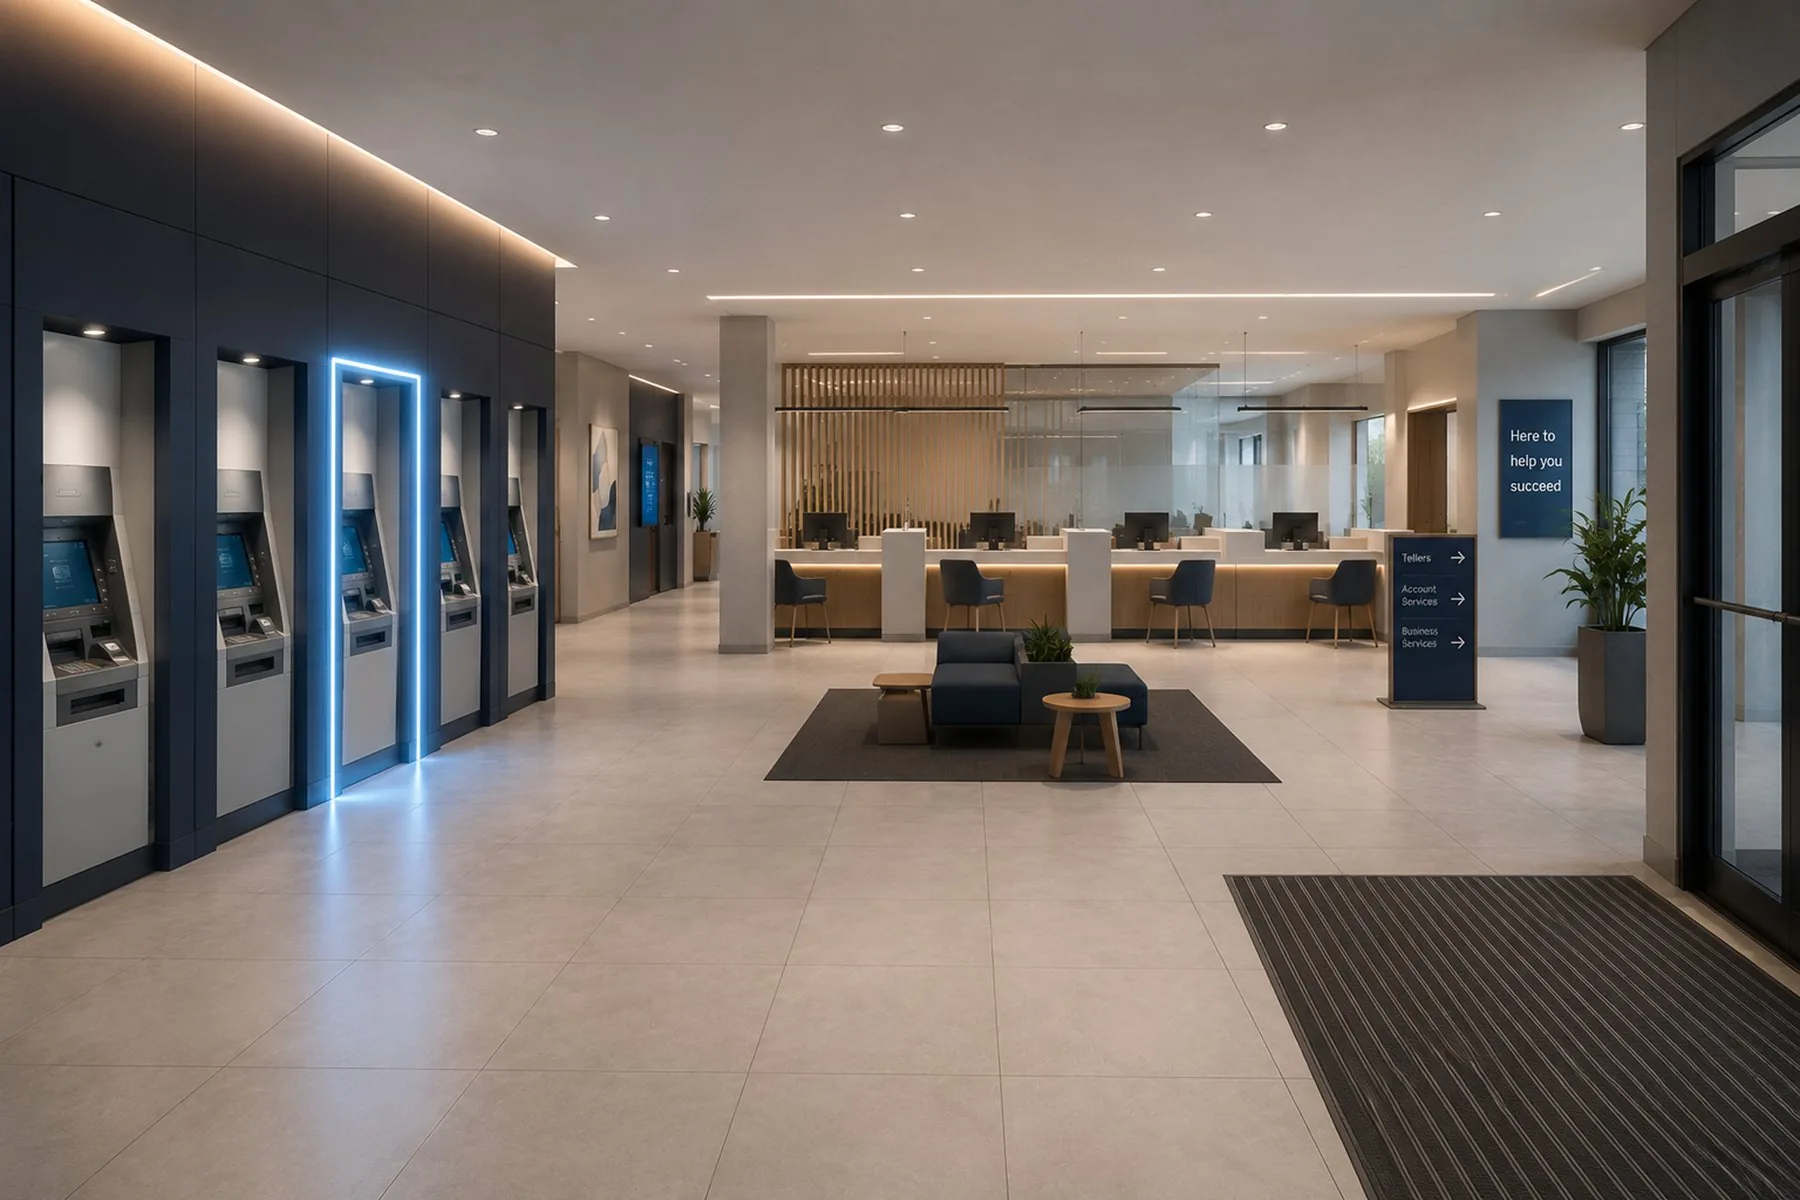
ATM 3 · 2× busier
ATM 3 busier than the others
- 16:21 · ActionCash team asked to top it up
- 16:40 · ScheduledTop-up booked before Friday
Explore Physical AI Agents
Network Score
Explore the Physical AI Platform
See your own locations
What is AI Analytics?
+
AI Analytics is Edge Signal’s AI video analytics for physical spaces. It turns existing camera feeds into real-time insight about how people move, gather, and spend time in stores, branches, restaurants, and venues, so businesses can understand traffic, attention, and queues across every location.
What can Edge Signal AI Analytics measure?
+
Edge Signal AI Analytics measures people counts, occupancy, visit duration, group sizes, estimated age range and gender, observed attributes such as clothing and accessories, dwell time, heatmaps, queue length, wait times, queue abandonment, and service utilization, for a single location or across an entire network.
How does AI people counting work?
+
AI people counting uses existing cameras to count people coming in and going out, hour by hour. Unlike traditional door counters, Edge Signal also measures live occupancy against capacity, visit duration, group sizes, peak hours, and weekly visitor trends, giving a fuller picture of how a space is used.
What are dwell time analytics and heatmaps?
+
Dwell time analytics measure how long people spend in a specific area, such as a display table or a seating zone. Heatmaps show where activity is concentrated and which areas people walk past. Together, they reveal which displays and zones capture attention and which are overlooked.
Can AI Analytics measure queue wait times?
+
Yes. Edge Signal measures queue length, average and peak wait times, time over target, and how many people leave the queue before being served. It also shows staff coverage and active service time, and Edgar can recommend actions such as opening another till during peak hours.
Does AI Analytics identify individual visitors?
+
No. Edge Signal AI Analytics reports on visitors as groups and segments, such as estimated age range, gender, group size, and observed attributes, without identifying individuals. Edge Signal does not collect or store personally identifiable information, and faces are blurred by default.
Does Edge Signal work with existing CCTV cameras?
+
Yes. Edge Signal works with compatible existing CCTV and security camera systems, using on-site Edge AI hardware to process video locally. Businesses can add AI Analytics without replacing their camera infrastructure. Camera compatibility and coverage are assessed during deployment planning.
Can I compare analytics across multiple locations?
+
Yes. Edge Signal brings analytics from every location into the Physical AI Platform. Teams can compare traffic, conversion, dwell time, and wait times between locations, follow historical trends, and benchmark each location against the best performer to see where improvements will have the most impact.
Can I ask questions about my analytics in plain language?
+
Yes. Edgar, Edge Signal’s Physical AI model, answers questions about your data in plain language, such as “Why did conversion drop at this store last week?” Edgar explains the result, connects metrics across locations, identifies likely causes, and recommends what to change.
What is the difference between AI Analytics and Physical AI Agents?
+
AI Analytics shows patterns over time, such as traffic, attention, and wait times. Physical AI Agents act in the moment: they watch for specific conditions, alert the right person, and track the follow-up. Used together, AI Analytics shows what to improve and AI Agents help teams act on it.
See more with the infrastructure you already have.
See what your existing cameras can reveal about visitor behavior, traffic patterns, and how your spaces are used.